vROPS | Custom Groups

It helps to group scattered VMs across multiple datacenters but belongs to same entity.

To elaborate,

Goal - I want to have a heatmap dashboard for all VMs of my client and in a single pane.
Challenge - My client's VMs are scattered around 4 data centers and in multiple folders and it is on vCloud Director platform. But vROPS will not be able to show the data in single pane of view because VMs are spread across and not in a single container.
Solution - Create Custom Group to monitor all those in a single pane of view. It will create a single container to give dashboard a source object to monitor and give the data.

Let's see how to do that...

My vROPS Version is 7.0.0.

Step 0: Login vROPS. Of course :)
Step 1: Click on "Environment" tab - Click on "Custom Groups" Under Groups and applications and then click on Green (+) icon
Step 2: Follow the below-

Name  - Type any name here. I will give it vCloudGroup
Group Type - Select the group where you want to place this group in. Here, many confuses. We can create a new "Group Type" as well or you can select existing "Group Type" if you want.
Policy - Select Default Policy, if you want know much about it.
Keep Group Membership up to date - Check the box

Now, Define the membership criteria-

Select the object type - We will select "Virtual Machine" here because our goal is around the virtual machine. If you have any other goal then it might change to host, datacenter, datastore etc..

Right below this option, I will click on drop down and will select the "Object Name". why?

Because for all the VMs, there is one thing in common that all have a specific word in their VM Name. My logic would be, "Bind all the VMs in this Group which has xxx in its name. got it?"

Next, I will select "Contains" and then "xxxx".

Now, you can click on okay but if you explicitly want any other VM of client, which doesn't have this xxx in its name then you can click on "Object to always include" or you don't want a particular VM to monitor then choose "Object to always exclude" and then click on save.

Now, search the Group Name "vCloudGroup" in vROPS search bar and will see all those VMs in it which has "xxx" in its name. It might take sometime to sync depending upon your environment size.


Feel free to put any question here!


Thank you,
Team vCloudNotes


Python | Web page automation with Selenium

Below example is to auto-login in web-page. Already there are lots of websites sharing the same but I would like to have all the info at one place(Because this is my vCloud Notes) :)

#Start here
from selenium import webdriver  #Install the selenium package
from selenium.webdriver.common.by import By
import time
import selenium, os, time
from selenium import webdriver
from selenium.webdriver.common.by import By
from selenium.webdriver.common.keys import Keys
from selenium.webdriver.common import keys
import pyautogui

baseUrl = "Enter URL here"
exepath = 'C:\\Python\\geckodriver.exe' # download and save geckodriver (for firefox)in this location. For chrome it is different one.
driver = webdriver.Firefox(executable_path=exepath)
driver.get(baseUrl)
time.sleep(7)
username = driver.find_element(By.XPATH, "//input[@name='username']").send_keys("gjohar")
password = driver.find_element(By.XPATH, "//input[@name='password']").send_keys("blablabla")
time.sleep(2)
#I applied below tweak to click on login button because in my situation, there was no ID or Class mentioned for login button.
pyautogui.hotkey("tab")
pyautogui.hotkey("Enter")

#End here.


Thank you,
Team vCloudNotes


NSX | MicroSegmentation

Micro-segmentation is a fancy term, basically it is kind of next level security provided by NSX. It is well known as "Micro" because it helps us to control the traffic flow even from a vNIC.

This Micro-segmentation basically we achieve by DFW that is Distributed Firewall.

Internet is already flooded with lots of articles and documentation on it. But here I will just simplify the things, but only for those who at least knows that what is NSX :)

How to apply it-

Step 0: Login vCenter server and go to Networking and Security plugin
Step 1: Create Security groups between which you want to apply the policy. It doesn't mean that it is possible only with security groups. You can apply the firewall policy between two VMs, portgroups, IP address, SGs, vAPPs etc. it is just and example.
Step 2: Create required firewall rules and apply on security groups
Step 3: It is done

Steps explained-

Let's say I want to apply security between APP and Web VMs.

I will create two Security Groups and will name them like SG_APP and SG_Web or anything you want.

Once done.

I will create firewall rules on the basis of below criteria.

Ex.1 - I want to block all the communication between WebServer1 and WebServer2 (Let's say I have multiple webservers)
Ex.2 - I want to allow all communication between web servers and app servers but only on port number 23
Ex.3- I want to allow all incoming connection coming toward web servers with any port number

In all the above rules, source and destination will be my Security Groups.

For example,

Ex.1
Source - SG_Web
Destination - SG_Web
Service - Any

Ex.2
Source - SG_APP
Destination - SG_Web
Service - 23

Ex.3
Source - Any
Destination - SG_Web
Service - Any

That's it!

Above is just an example and to explain the workflow. You can anyhow manipulate the security policies and firewall as per your requirement.

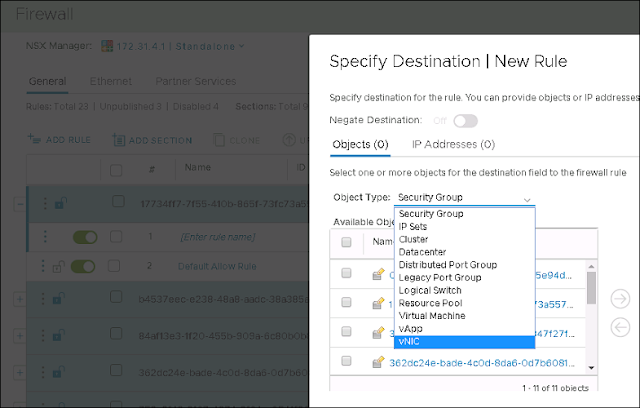
Below is an example that what can be in the source and destination list. As I said it give us option to select even a vNIC. Scroll down and you will get an idea.


Now let's think about one use case of, where we might need to select vNIC as a source or destination. I have a VM which is internet facing as well as it can access my internal network as well and of course have two vNICs (One is internet facing and second is intranet facing)

I don't want any traffic can go from my one vNIC to another vNIC.

Got an idea?

Still any doubt.Feel free to comment. I will answer it for sure..


Thank you,
Team vCloudNotes


vROPS | Health Check of cluster

Sometime we have to check the cluster health. In terms of database size, collected metrics size etc..

for that I have a script which gives you very beautiful view of each and every thing of all the vrops cluster nodes. Run the script and you see it by yourself.

Step 1: Login vrops master node with root
Step 2: Copy below script and paste in CLI interface of vROPS


 echo -e "\e[1;31mHOSTNAME:\e[0m" > $HOSTNAME-status.txt | hostname >> $HOSTNAME-status.txt;getent hosts | nslookup >> $HOSTNAME-status.txt; uname -a >> $HOSTNAME-status.txt; echo -e "\e[1;31mDNS CONFIGURATION:\e[0m" >> $HOSTNAME-status.txt | cat /etc/resolv.conf >> $HOSTNAME-status.txt; cat /etc/hosts >> $HOSTNAME-status.txt; echo -e "\e[1;31mVERSION INFO:\e[0m" >> $HOSTNAME-status.txt | cat /usr/lib/vmware-vcops/user/conf/lastbuildversion.txt >> $HOSTNAME-status.txt; echo -e "" >> $HOSTNAME-status.txt;cat /etc/SuSE-release >> $HOSTNAME-status.txt; echo -e "\e[1;31mDATE:\e[0m" >> $HOSTNAME-status.txt | date >> $HOSTNAME-status.txt; echo -e "\e[1;31mSERVICES:\e[0m" >> $HOSTNAME-status.txt | service vmware-vcops status >> $HOSTNAME-status.txt; echo -e "\e[1;31mCASA:\e[0m">> $HOSTNAME-status.txt| service vmware-casa status >> $HOSTNAME-status.txt; echo -e "\e[1;31mDISKSPACE:\e[0m" >> $HOSTNAME-status.txt | df -h >> $HOSTNAME-status.txt; echo -e "\e[1;31mHEAPDUMP:\e[0m">> $HOSTNAME-status.txt | ls -lrSh /storage/heapdump/>> $HOSTNAME-status.txt; echo -e "\e[1;31mIFCONFIG:\e[0m">> $HOSTNAME-status.txt | ifconfig >> $HOSTNAME-status.txt; echo -e "\e[1;31mCASADB.SCRIPT:\e[0m" >> $HOSTNAME-status.txt | tail -n +51 /data/db/casa/webapp/hsqldb/casa.db.script >> $HOSTNAME-status.txt; echo -e "\e[1;31mROLE STATE:\e[0m">> $HOSTNAME-status.txt | grep adminroleconnectionstring /usr/lib/vmware-vcopssuite/utilities/sliceConfiguration/data/roleState.properties >>$HOSTNAME-status.txt | grep adminroleenabled /usr/lib/vmware-vcopssuite/utilities/sliceConfiguration/data/roleState.properties >>$HOSTNAME-status.txt; echo -e "\e[1;31mGEMFIRE PROPERTIES:\e[0m">> $HOSTNAME-status.txt | grep locators /usr/lib/vmware-vcops/user/conf/gemfire.* >> $HOSTNAME-status.txt; grep bind-address /usr/lib/vmware-vcops/user/conf/gemfire.* >> $HOSTNAME-status.txt; grep shardRedundancyLevel /usr/lib/vmware-vcops/user/conf/gemfire.properties >> $HOSTNAME-status.txt;grep "serversCount" /usr/lib/vmware-vcops/user/conf/gemfire.properties >> $HOSTNAME-status.txt; echo -e "\e[1;31mPERSISTENCE PROPERTIES:\e[0m">> $HOSTNAME-status.txt | grep ^db* /usr/lib/vmware-vcops/user/conf/persistence/persistence.properties >> $HOSTNAME-status.txt; grep replica* /usr/lib/vmware-vcops/user/conf/persistence/persistence.properties >> $HOSTNAME-status.txt; grep "repl.db.role" /usr/lib/vmware-vcops/user/conf/persistence/persistence.properties >> $HOSTNAME-status.txt; echo -e "\e[1;31mCASSANDRA YAML:\e[0m" >> $HOSTNAME-status.txt | grep broadcast_rpc_address: /usr/lib/vmware-vcops/user/conf/cassandra/cassandra.yaml >> $HOSTNAME-status.txt | grep listen_address: /usr/lib/vmware-vcops/user/conf/cassandra/cassandra.yaml >> $HOSTNAME-status.txt; echo -e "\e[1;31mNODE STATE INFO:\e[0m">> $HOSTNAME-status.txt | $VMWARE_PYTHON_BIN $ALIVE_BASE/tools/vrops-platform-cli/vrops-platform-cli.py getShardStateMappingInfo | sed -nre '/stateMappings/,/}$/p' >> $HOSTNAME-status.txt; echo -e "\e[1;31mWRAPPER RESTARTS:\e[0m" >> $HOSTNAME-status.txt |find /usr/lib/vmware-vcops/user/log/ -name "*wrapper.log" -print -exec bash -c "grep 'Wrapper Stopped' {} | tail -5" \; | cut -d'|' -f3 >> $HOSTNAME-status.txt; echo -e "" >> $HOSTNAME-status.txt; echo -e "\e[1;4;35mPERFORMANCE RELATED INFORMATION\e[0m" >> $HOSTNAME-status.txt; echo -e "" >> $HOSTNAME-status.txt; echo -e "\e[1;31mvCPU INFO:\e[0m" >> $HOSTNAME-status.txt |grep -wc processor /proc/cpuinfo >> $HOSTNAME-status.txt; echo -e "\e[1;31mMEMORY INFO:\e[0m" >> $HOSTNAME-status.txt | awk '$3=="kB"{$2=$2/1024**2;$3="GB";} 1' /proc/meminfo | column -t | grep MemTotal >> $HOSTNAME-status.txt; echo -e "\e[1;31mTOP OUTPUT:\e[0m" >> $HOSTNAME-status.txt; /usr/bin/top -d 0.5 -n 1 -b | head -5 >> $HOSTNAME-status.txt; echo -e "\e[1;31mADAPTER TYPE OBJECT COUNTS:\e[0m" >> $HOSTNAME-status.txt; su - postgres -c "PGDATA=/storage/db/vcops/vpostgres/repl PGPORT=5433 /opt/vmware/vpostgres/current/bin/psql -d vcopsdb -c 'select count(*),adapter_kind from resource group by adapter_kind;'" | awk '{ SUM += $1; print} END {print "Total";print SUM }' | cut -d ':' -f 5 >> $HOSTNAME-status.txt; echo -e "\e[1;31mCASSANDRA ACTIVITIES:\e[0m" >> $HOSTNAME-status.txt | /usr/lib/vmware-vcops/cassandra/apache-cassandra-2.1.8/bin/./nodetool --ssl -h 127.0.0.1 --port 9008 -u maintenanceAdmin --password-file /usr/lib/vmware-vcops/user/conf/jmxremote.password  cfstats -H globalpersistence.activity_2_tbl >> $HOSTNAME-status.txt; echo -e "\e[1;31mALERT DB COUNT:\e[0m" >> $HOSTNAME-status.txt | su - postgres -c "/opt/vmware/vpostgres/9.3/bin/psql -d vcopsdb -A -t -c 'select count(*) from alert'" >> $HOSTNAME-status.txt; echo -e "\e[1;31mALARM DB COUNT:\e[0m" >> $HOSTNAME-status.txt | su - postgres -c "/opt/vmware/vpostgres/9.3/bin/psql -d vcopsdb -A -t -c 'select count(*) from alarm'" >> $HOSTNAME-status.txt; less -r $HOSTNAME-status.txt


Step 3: If you have any doubt on output of this script you can run in your test environment first. I use this script many times to check the health of vROPS.

Below snippet is taken after running this command. You will get more data by keep pressing the down arrow key in your vrops putty session (note here :D)


Thank you,
Team vCloudNotes

Zerto Virtual Manager | Change Recovery VRA VM with powershell cmdlet

As a pre-requisite, you might need to download and install Zerto PowerShell Package from here


#Start here
clear
function LoadSnapin{
param($PSSnapinName)
if (!(Get-PSSnapin | where {$_.Name -eq $PSSnapinName})){
Add-pssnapin -name $PSSnapinName
}
}
# Loading snapins and modules
LoadSnapin -PSSnapinName "Zerto.PS.Commands"
clear
Write-host "Welcome to Zerto Powershell Script to change the Recovery VRA VMs one by one" -ForegroundColor Yellow
echo "################################ZERTO CMDLETS#####################################"
$ZVM =  read-host "Enter IP address of ZVM server "
Write-host "What is the full name of source host in vCenter Server? " -ForegroundColor yellow
$sourcehost = Read-host "Enter source host name "
Write-host "List of VMs is being extracted. Please bear with me." -ForegroundColor Green
Get-VMsReplicatingToHost -HostIp $sourcehost -ZVMIP $ZVM -ZVMPort 9080 -Username administrator -Password password

write-host "Which VM you want me to migrate? Select any VM in above list please  " -ForegroundColor Yellow
$VM = Read-Host "Enter VM Name "
Write-host "What is the full name of destination host in vCenter Server? " -ForegroundColor yellow
$desthost = Read-host "Enter destination host name "
Set-ChangeRecoveryHost -VMname $VM -CurrentTargetHost $sourcehost -NewTargetHost $desthost -ZVMIP $ZVM -ZVMport 9080 -username Administrator -password password -ErrorAction SilentlyContinue

Zerto Virtual Manager | Pause replication on all VPGs with CMDlets

It is simple, if you know it. Let's us powershell to do that.

function LoadSnapin{
param($PSSnapinName)
if (!(Get-PSSnapin | where {$_.Name -eq $PSSnapinName})){
Add-pssnapin -name $PSSnapinName
}
}
# Loading snapins and modules

LoadSnapin -PSSnapinName "Zerto.PS.Commands"

$VPGs = Get-ProtectionGroups -ZVMIP 1.1.1.1 -ZVMPort 9080 -Username administrator -Password password -SiteName ALL

#1.1.1.1 - ZVM Server IP
#9080 - ZVM port number
#administrator - username
#password - Password
#ALL - It is for all sites. Because service provider might have many sites connected to it.

foreach ($VPG in $VPGs){

Pause-ProtectionGroup -ZVMIP 172.22.2.30 -ZVMPort 9080 -Username administrator -Password password -ErrorAction SilentlyContinue -VirtualProtectionGroup $vpg -Confirm:$false
}

Please note: Run any script in your test environment first before applying into production. There is no harm in running above script but it is just an information :)
,

vCenter Server | How to get percentage free space of a datastore?


$vcenter = read-host "Enter vCenter server FQDN "
Connect-VIServer $vcenter
echo "Welcome to Datastore free space calculator tool"
echo ""
echo " Press 1 to search details for single datastore"
echo " Press 2 to search details for all the datastores"

$data = Read-Host "Enter your choice"
If($data -eq 1 )
{
$a= Read-Host " Please enter the name of DS"
$DS= Get-Datastore
Get-Datastore | where{$_.Name -eq $a} | Select @{N="DataStoreName";E={$_.Name}},@{N="Percentage Free Space(%)";E={[math]::Round(($_.FreeSpaceGB)/($_.CapacityGB)*100,2)}} | Where {$_."Percentage(<20%)" -le 20}
}

elseif ($data -eq 2 )
 { 
Get-Datastore | Select @{N="DataStoreName";E={$_.Name}},@{N="Percentage Free Space(%)";E={[math]::Round(($_.FreeSpaceGB)/($_.CapacityGB)*100,2)}} | Where {$_."Percentage(<20%)" -le 20}

}


,

NSX | How to disable SSH on all NSX edges?


Enabled SSH can be a security threat so it is recommended to keep it disabled and enable only when highly required.

Again disabling it manually is a tedious task (at least for me) so I thought to do it through powershell.

Below example is for selected edges, in case you want it to run for all then simply remove the source file and run "Get-Nsxedge". 

To disable SSH on selected Edges
 
#Connect NSX Manager and replace 1.1.1.1 with actual IP address of NSX Manager
Connect-NsxServer -nsxserver 1.1.1.1
#put a file with edge-ID in below location. In case you want to disable on selected edges
foreach($edgelist in (Get-Content -Path C:\TEMP\edgelist.txt)){
#below command will disable ssh on all the mentioned edges in above .txt file 
Get-NsxEdge -objectId $edgelist | Disable-NsxEdgeSsh -Confirm:$false
#Let's cross check the status after disabling it
$ssh = Get-NsxEdge -objectId $edgelist
$ssh.id
$ssh.clisettings.remoteaccess
}


To disable SSH on all NSX edges.
 Connect-NsxServer -nsxserver 1.1.1.1
 Get-NsxEdge  | Disable-NsxEdgeSsh -Confirm:$false


Any query? Feel free to ask.


Thank you,
Team vCloudNotes


, ,

NSX | How to get IPSec VPN Tunnel Statistics for all NSX edges

I simply recalled the NSX API through powershell and got the required result.

#Start
clear
#replace 1.1.1.1 with actual IP address of NSX Manager
Connect-NSXServer -NSXServer 1.1.1.1

#Put all the edge-IDs in below location, for which you want to see the result.
$edgeids = Get-Content -path C:\Temp\gjohar.txt

 foreach($edgeid in $edgeids){
 
   $EdgeApi =  Invoke-NSXRestMethod -method "GET" -uri "/api/4.0/edges/$edgeid/ipsec/statistics"
   $EdgeApi.ipsecStatusAndStats.InnerText

   }
#End
 

I haven't taken output in a file. I just ran the command, copied entire data and pasted in notepad++ to review. But if you want, you can do so.


Below is the sample output.

Note that : output for each edge's data is separated with help of "out-string". One liner output is for those edges which don't have any VPN configured.


Feel free to comment in case of any query\doubt. We are quite reactive.


Thank you,
Team vCLoudNotes

,

NSX | How to Connect NSX Manager in Rest API client?

To connect with APIs of NSX Manager, you can use any tool like Postman or Insomnia.

Let's see, how we can do that.

I use insomnia, so will demonstrate via insomnia only. However process is quite similar.

Step 1: Install and open Insomnia

1.a : It is freeware tool and downloaded from here. Please get it installed on your pc
1.b : As usual an icon will be placed on your desktop in installation process
1.c : Open it and you will see this tool as similar as below.


Step 2: Connect NSX manager
2.a : Authentication is the first step before doing any other thing. isn't it? For authentication, select basic authentication (as shown above)
2.b : Give username and password of NSX manager, again as shown in above image.
2.c : Enter NSX manager URL as shown above "https://192.168.1.1" and make sure GET is selected and press Send.

If you get that green "200 OK" message then you are connected guys else check your credentials.

That's it! You are connected with NSX Manager now in your RestAPI client.

I will post more on API operations some other day! Stay tuned.


Thank you,
Team vCloudnotes


Zerto Virtual Manager | How to read xml file extracted from ZVM (Zerto Virtual Manager)

To explain it completely, let me share the thought behind this post-

In ZVM, when we recreate any VPG, we export its setting (Which include VMs name, IP settings, failover network, test network etc) before deleting it. So that, we don't need to create it from scratch and manually.

When we have this exported settings, we just import it back and VPG automatically get created. This setting which we export and import, does save in .xml file format.

In case, we don't export the settings before deleting any VPG then it is bit lengthy process to recreate it from scratch. Sometime it happens like we have exported the settings but now not able to import it back (due to n numbers of reasons).

In that case, now we have to recreate the VPG. But being in operations, it is not very easy to go to client and request to share all the details again or we sometime not comfortable to request client to recreate the VPG.

In that case, we need this exported .xml file, which we must know how to read it and write down all the setting of a VPG and the configure accordingly.

So hopefully, we got the essence, now let's proceed how to read .xml file

Note 1: .xml file content save in reverse order
Note 2:  name of VM, datastore and network, will be mentioned in UID format and not with general name as shown in vcenter server
Note 3:  read this .xml file in any web-browser rather than in notepad++ or any text editor application

Let's say I have a VPG named "VPG_11" and I have to read all its configuration from exported file.

I have created below you tube videos, just to make it simpler for me to explain. Any doubt, ask me..


Zerto Virtual Manager | How to read xml file part-I


Zerto Virtual Manager | How to read xml file part-II


Zerto Virtual Manager | How to read xml file part-III


Thank you,
Team vCloudnotes


vROPS | Views

vROPS is an amazing tool and it is essential to know about "Views and Reports" feature, which is kind of "must know" thing who work on vROPS. Let's explore how you can create "Views and Reports" and take benefit out of it.

I will explain it with one use case.

Use Case: Under some customer issue, my manager wants me to extract the information like, how much memory was assigned to this particular VM one week before or let's say on a date in past (it can be 6 months old).

You need to understand the request first and then translate it into vROPS language (it demands experience on this tool). I think, request is pretty clear and simple and if I say in vROPS language then your manager wants to check the trend because such request comes under trend in vROPS's view.

* All snippets are taken from vROPS version 7.0.0

Step 1: Login vROPS with admin privileges
Step 2: Go to Views as shown in below image and click on green plus (+) sign to create new view


Step 3: Fill the form like

Name: Give any name, I give it memory_Trend_Check
Presentation: Select Trend and keep everything else as default
Subjects: search"virtual machine" and select it (not VM name). Just type "virtual machine".
Note: If you have multiple platform integrated with vROPS like vRA\vCD\AWS/Azure etc.. then you will get many option under which you need to chose the target VM's platform.
Data: Here you will see multiple options like CPU, Memory, Datastore, Disk space etc. etc..
We need to focus on memory. Expand the memory option and select "Total Capacity"
Visibility: let it be default, at least as of now. If you want to make any changes, you can.

Click on Save.

Below is reference snippet.


Step 4: Search the VM from vROPS search bar and put the VM name here.

It will give you the option to select the VM Name -> Click on the VM Name

You will get below stage


Step 5: Now move your cursor to right and select "Details" tab. As visible in above snippet

Step 6: Here, you will get option to select the view. Search the view in right search bar with name "Memory_trend_check". It will populate this view in front of you.

Step 7: Select this view and check the trend in below window.


On 03:56 AM, memory was 1 GB.

Because time interval is too short so changes will not be visible crystal clear but still explainable. Now I increased the memory to 2 GB and then 3 GB. See the below snippets.


On 04:21 AM, memory is 2 GB. When memory was changed in the interval of days, you will be able to see the clear spikes up and down (in case of memory decreased).


On 04:46 AM, it is now 3 GB. It shows very little line diversion because of short period of time.

Likewise, you can create view to extract any kind of metric of your virtual machine. For example:

- How many VMs are running with outdated vmware tools
- What is the CPU contention, CPU usage or workload on this VM
- What is the historical workload of CPU and memory on this VM
- When any VM was reset in past

There are n numbers of things which you can do from this "View"

Please ask, if any question or doubt.


Thank you,
Team vCloudNotes

NSX | Troubleshooting tricks to solve communication issues between two VMs in NSX environment

When I say between two VMs, there can be many use cases as below

Use Case 1: These two VMs can be on same host and in same VXLAN
Use Case 2: These two VMs can be on same hosts and in different VXLAN
Use Case 3: These VMs can be on different host and in same VXLAN
Use Case 4: These can be on different hosts and in different VXLAN
Use Case 5: There might be edge router or firewall coming in between
.
.
.
etc....

*portgroup=VXLAN

In any of the Use case, even when you do know or don't know the architecture and even you don't know the port\firewall configuration, you can troubleshoot this issue.

Simply, use "Traceflow" for NSX. You can find it in NSX plugin for vCenter Server.

How to use it?

Login vCenter server and go to Networking and Security plugin.

Click on Traceflow as shown below and follow the given steps


You will notice that packet has been successfully delivered to its destination by following the path.

Source vNIC -> Firewall -> logical switch -> physical media -> Firewall --> destination vNIC

You will also notice that there are two entries for firewall after ejection from source vNIC and before receiving of packet to destination vNIC.

This is because first packet was received by the firewall and then forwarded by the firewall. However it is also crystal clear from the above diagram if you see thoroughly.

Now let me give you an example of failed delivery.

Downloaded from docs.vmware.com
 Here, you can clearly see that packet is dropped between source and destination.

Check that at which stage it was dropped. You will see that on firewall it dropped due to rule number 1013. Now further you can check the firewall rule and make it allow as per your requirement.

Hopefully it was quite knowledge and easy to troubleshoot such communication issue.

This method is also helpful to know the communication path between two VMs when you don't know. isn't it?

Feel free to ask any question!


Thank you,
Team vCloudNotes

NSX | How to capture network traffic on NSX edge and download captured file?


Capturing network traffic and downloading .pcap file is kind of must know thing when we do any network troubleshooting in NSX environment.

To do so, you need to follow below steps in order-

Step 1: Take console or putty of NSX edge device
Step 2: login with admin credentials (username "root" doesn't work in NSX :))
#Hopefully you know how to know\reset credentials of NSX edge. If not, let me know.
#When we say that capture the traffic, it does mean that traffic is flowing. If not then initiate a traffic first between source and destination. If both are VMs, then start a ping from source VM to destination VM.
Step 3: Run below command on NSX edge (putty\console)to start capturing the traffic


debug packet capture interface vNic_0

Please note:
1. After few seconds, stop the capture by pressing CTRL+C.
2. Output will looks like as shown below
3. Above command will capture all the traffic hitting on vNic_0 of this edge and will save a file in appliance storage only. That is why, it should not keep running for longer period of time like 1-2 hours. Which will further creates edge performance related issue.

 #Now let's see how to download it

Step 4: Run below command

debug copy ftp gjohar@ftp server IP address:/ tcpdump_vNic_4.0

For example : debug copy ftp gjohar@100.0.0.10:/ tcpdump_vNic_4.0

Please note:
1. gjohar - username created on ftp server
2. FTP should be accessible from internet and should be reachable by NSX edge on ping etc.
3. tcpdump_vNic_4.0 - It is the file to download which automatically named while creation. Name can be different in your case so to confirm the file name you can simply run below command after stop capturing

Step 4.1 : debug show files

Once you run the command show in step4, you will see this file in your FTP server. Now you can open, share and check the file as per your wish.

Dig in bit deeper
In above steps, I have explained capturing all the traffic on an interface. Now let's see how to capture a particular IP's traffic on this interface that is vNic_0

You just need to modify the capture command as below.

#debug packet capture interface vNic_0 -n_src_host_1.2.3.4

Please note:
1.2.3.4 - It is the IP address which we want to capture.

Dig in bit more deeper

I want to capture a packet with source and destination information. 

#debug packet capture interface vNic_0 host_192.168.11.3_and_host_192.168.11.41

Please note:
192.168.11.3 - Source
92.168.11.41 - Destination

Let's Dig in little more deeper

Now, I want to see if source and destination are communicating over port number 80 (or any other)

#debug packet display interface vNic_0 host_192.168.11.3_and_host_192.168.11.41_and_port_80

Please note:

1. I have used vNic_0 just for example purpose. You need to change it as per your requirement and as per egress or ingress traffic. For example, if two VMs are in same subnet, both will communicate over same logical switch but if these are in different subnets then traffic first will be in and out from and to one interface (vNic_0) and then in and out from and to second interface (vNic_1)

2. If you just want display the traffic and don't want to capture them then just replace the work capture with display in all the above commands.

That's it folks for now!
Any doubt, want to ask?


Thank you,
Team vCloudNotes

NSX | When and why we need to redeploy NSX edge?

Hi Guys,

So, Edge or ESG (Edge service Gateway) is component of NSX which provide services from L3-L7  that is from routing to load-balancing.

I have seen few cases where communication was impacted between the VMs on either side of ESG. For example, VM in SITE A and VM in SITE B is not pinging with each other and there is a actual outage.

And I checked I found no changes were made in physical network as well in NSX environment. Also, ESG any interface's IP was not reachable but there were no visible errors. In most of the case, if there is any health issues with ESG then it highlights and recommend to redeploy (For example, API requests are failing or ESG is not responding to health monitor) but in some cases, it neither show any error nor give any recommendation but all of sudden it went into unreachable state (Of course due to some reasons) but unidentified.

Please note that you will find VMware KBs on most of the issues where it is known that it needs to redeploy but always keep in mind the situation I am here talking about.

In those cases, we sometime have to redeploy the edge. Ideally it is 2-3 minutes of task but it depends upon your environment. I have seen it completing in 30-40 minutes also :)

In order to redeploy an edge, you just need to

Step 1: login vCenter server from WebClient
Step 2: Go to "Networking and Security" page
Step 3: Click on NSX edges
Step 4: Search edge with edge-ID or any other info you might have
Step 5: Download tech support bundle for that edge
Step 6: Right click and select redeploy

Alternatively, you can use below powershell command to redeploy the edge.

#Start here
#This script will help you to target and redeploy multiple edges which you will specify by putting a list in C:\Temp folder

$nsx = Read-host "NSXManager IP address"
connect-nsxserver -nsxserver $nsx

#place a list of edges in notepad file in C:\Temp with name edgelist.csv

foreach($edgelist in (Get-Content -Path C:\TEMP\edgelist.csv))
{
   Get-NSXedge -objectId $edgelist | Repair-NSXedge -Operation redeploy -Confirm:$false
}

#End here

In case, you want to continue, in case of any error then add -ErrorAction SilentlyContinue

Command will be as shown below-

#Start here
#This script will help you to target and redeploy multiple edges which you will specify by putting a list in C:\Temp folder

$nsx = Read-host "NSXManager IP address"
connect-nsxserver -nsxserver $nsx

#place a list of edges in notepad file in C:\Temp with name edgelist.csv (Don't give the source as .txt)

foreach($edgelist in (Get-Content -Path C:\TEMP\edgelist.csv))
{
   Get-NSXedge -objectId $edgelist | Repair-NSXedge -Operation redeploy -Confirm:$false -ErrorAction SilentlyContinue
}

#End here


Thank you,
vCloudNotes


vCloud Director | How to re-synchronize inventory of vCenter server with vCD

Basically we need to do this due to stale entries in vCD database. It happens when any object get removed\deleted directly from vCenter while it was being managed by vCD.

Hence vCD don't know if that was deleted and treat it like live object which creates issues in vCD operations. By re-sync inventory, vCD re-read all the inventory of vCenter server and update in database which resolve the issue.

It demands downtime as well. Depending upon your environment it takes few minutes to an hour.

Step 1: Take backup of vCD database.
Step 2: Take backup of vCenter database.

In order to minimize the impact, you should do this on all vCD cells one by one. First quiesce(stop) all the jobs coming on a cell.

Step 3:  Login to the vCloud Director cell via SSH as root and change directory to where the cell-management-tool is located. Below is the command.

  # cd /opt/vmware/vcloud-director/bin

Step 4: Run the tool to verify the job count and active state (true):

  # ./cell-management-tool -u administrator cell -t

#below is the command output

Please enter the administrator password:

Job count = 2

Is Active = true
#End here


Step 5:  Use the quiesce feature to ensure the cell takes no new jobs

  # ./cell-management-tool -u administrator cell -q true

Please enter the administrator password:


Step 6: Run the tool to verify the job count and active state (false):

  # ./cell-management-tool -u administrator cell -t

Please enter the administrator password:

Job count = 0

Is Active = false

Step 7: Restart the cell once the Job count = 0 and Is Active = false:

  # ./cell-management-tool -u administrator cell -s

Please enter the administrator password:


Step 8: Stop the vCloud Director services:

  # service vmware-vcd stop

#Below is the output of above command

Stopping vmware-vcd-watchdog:        [  OK  ]

Stopping vmware-vcd-cell:            [  OK  ]

#End here

****NOTE: You must stop ALL of your cells before proceeding to the queries****  


Step 9: Once above process is carried out on all the cells. Access and connect vCD database and paste below lines


#start here

Delete from task;


delete from audit_event;

delete from jobs where job_id not in(select job_id from job_detail);

update jobs set status = 3 where status = 1;

update last_jobs set status = 3 where status = 1;

delete from busy_object;

delete from QRTZ_SCHEDULER_STATE;

delete from QRTZ_FIRED_TRIGGERS;

delete from QRTZ_PAUSED_TRIGGER_GRPS;

delete from QRTZ_CALENDARS;

delete from QRTZ_TRIGGER_LISTENERS;

delete from QRTZ_BLOB_TRIGGERS;

delete from QRTZ_CRON_TRIGGERS;

delete from QRTZ_SIMPLE_TRIGGERS;

delete from QRTZ_TRIGGERS;

delete from QRTZ_JOB_LISTENERS;

delete from QRTZ_JOB_DETAILS;

delete from compute_resource_inv;

delete from custom_field_manager_inv;

delete from ccr_drs_vm_host_rule_inv;

delete from cluster_compute_resource_inv;

delete from datacenter_inv;

delete from datacenter_network_inv;

delete from datastore_inv;

delete from dv_portgroup_inv;

delete from dv_switch_inv;

delete from folder_inv;

delete from managed_server_inv;

delete from managed_server_datastore_inv;

delete from managed_server_network_inv;

delete from network_inv;

delete from resource_pool_inv;

delete from storage_pod_inv;

delete from task_inv;

delete from task_activity_queue;

delete from activity;

delete from activity_parameters;

delete from failed_cells;

delete from lock_handle;

delete from vm_inv;

delete from property_map;

commit;


#End here


Step 10: Once done, start all the vCD cells services and check vCD portal accessibility. 


Please note: After this operation, you will see errors on all OrgvDCs which is normal, you can ignore and clear those alerts.


Disclaimer: It is destructive process so, it is recommended to do the same in supervision of some experienced person or under guidance of VMware.